Predicting and managing river flows is essential for flood control, water supply, agriculture and energy production. However, knowing how to measure these flows is a prerequisite.
This constitutes hydrometry, which is a distinct complement to hydrology (the science of water in its natural environment) and hydraulics (the physics of flow). About one-third of rainwater on the continent returns to seas and oceans (the other two-thirds evaporate directly or are consumed by plants).
Globally, nearly 36,000 km 3A large amount of water flows through the river every year. However, the distribution of these quantities can be very uneven from one continent to another, and (for the same river) from one year to another or within the same year. This irregularity can only be resolved by permanently measuring the flow of these rivers. However, continuous measurements of river flow are not directly available and are the result of an experimental process that combines multiple field observations.
1. Measuring river flow is a problem that has long troubled the industry. What kind of flow meter should be chosen?
Hydrology, a distinct and complementary science from hydrology (the science of water in the natural environment) and hydraulics (the physics of water flow), is a discipline that aims to measure the flow of rivers. Flow - the amount of water flowing through a river over a period of time - expressed in cubic meters per second (m3/s).
Every waterway followsSpecific system, theSystemDepends onPrecipitationRhythmAnd its hydrological "terroir." For the Amazon, the most populous river in the world, there are only one or two changes in flow between the two extremes of the same month. From one year to the next, its average annual flow is 206,000 m 3 The /s value only varies around 10% to 15%. inThe Amazon is a very ordinary river.On the other hand, African rivers like Chari have an average discharge of 1197 m at the outlet of Lake Chad 3 /s. Within the same year, the flow variation between two extreme months is a factor of 20 (150 to 3000 m 3 /s). While from one year to the next, the average annual flow can vary by two factors: 739 m3In 1942/S, 1720 m3 /s in 1956The sari thus has a more contrasting system.
But how do you measure these flows? Since ancient times, human beingsAt leastInterest in it arose at a time of dependence on agriculture. But this is a much harder question than familiarity. James Jeans (British physicist, 1877-1946) wrote: "The total radiation emitted by the sun in a unit of time, converted into mass, is about 10,000 times that of the water flowing in the Thames under London Bridge; by the way, if the factor 10,000 is the total value, it is not because we do not know the exact mass of solar radiation, but because we cannot measure the average flow of the Thames. »
Let DOWESTON sales engineers choose a suitable river flow meter for you
2. Why measure river flow now? What is the purpose of river flow measurement?
The measurement of river flow serves several purposes:
Hydraulic structure: (Hydroelectric power generation facilities, irrigation systems, flood control tanks or low water support systems, etc.)Operations management;Determine the structure of these structures by understanding the characteristics of these waterwaysDimensions;
Regulatory controls: Used to verify the discharge obligations downstream of the building (minimum water flow to ensure fish survival, maintain other uses; not exacerbate floods), disaster status declaration (drought...);
Flood prevention:By flood warning
Protect property and people: Adopted a series of constitutionsLong termObservation, it is necessary to know the evolution of river regimes, to increase awareness of natural risks, to assign a probability to extreme events (floods, low water levels).
Currently,Global warmingChallenges, between different uses (recreation, energy, irrigation, drinking water)Sharing waterNew needs, natural environmentAnd the restoration of its biodiversity orPreservation of the natural environmentSocial needs, so that the benefits of these measures are obtainedStrengthen.Knowledge,AddedSocialVulnerability.
It should be noted that the French metropolis currently has approx.3500Hydrological stations, mainly managed by the Ministry of Environment and operators of hydroelectric or irrigation projects. exceed80%The signal is transmitted in real time. This density (0.63/100km²) is atWestern European average,About the same as the UK, higher than Spain, but lower than Switzerland or Germany.
3. How to measure river flow?
Direct flow measurement is a complex operation and can only be performed occasionally. Except in very special circumstances, direct continuous monitoring of traffic is not possible. passed in advanceCalibration curveAfter connecting the water level to the flow rate, it is measured continuously.Water level. This is why moisture determination is aFour stepsProcess:
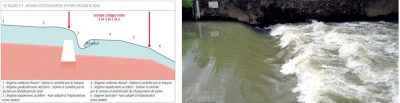
Figure 3. Hydraulic control in a river; schematic on the left; an example in a river on the right. Note that once the threshold is exceeded, a torrent regime develops, followed by a hydraulic jump that creates eddies and significant energy losses.
InHydraulic control deviceMeasure continuously upstream (see Figure 3) or at another location where a unique height-flow relationship can be establishedHeight, Realize this relationship(Calibration curve) on a regular basisRubricImplementation so that height can be converted into flow,The calibration curve ofLayoutAnd its evolutionDetection, Then, after converting height to flow,YesSpace-time fluctuationsStrictAnalyze and then archive it.
3.1 Continuous measurement of height
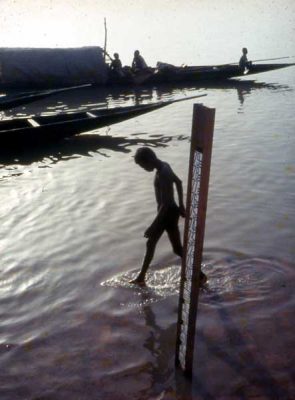
For a long time,Height measurementInclude visual readings on the scale (Figure 4) taken daily (or at a shorter frequency). Over time, the process has been automated by installing sensors outside of these reference scales that monitor altitude changes in time steps to adapt.flowFluctuations (in small flood basins this response is very sensitive; in large plain basins it is smoother). Several generations of sensors now coexist on the network: float, pneumatic, piezoresistive, super-submerged acoustic, differential conductivity measurement, etc.
Figure 4. Scale of Niger in Mopti
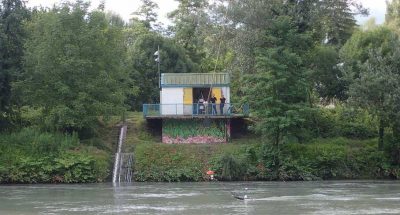
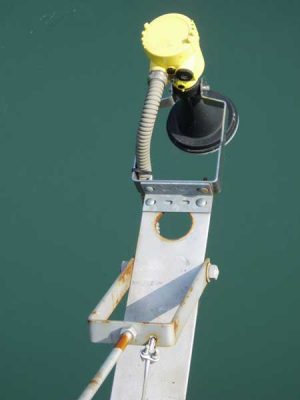
All these devices are placedIn or in contact with water; TheRadar(Figure 5) - which emerged in the early 2000s - offered the guaranteed advantage of water coming out (Better durability, because it isInvulnerable to invasionWater, sediment and floating in rivers) and toTemperatureInsensitive (What emerging ultrasound lacksCharacteristics). However, the need to move the radar away from the coastline (edge effect) and the wave reception task mediated by the waveguide may work against the representativeness of the measurements relative to the reference scale.
RegularlyTo the entire area accessible to the riverflowRange (during drought, moderate water and flood)Regular measurements, mainly by exploring velocity fields or diluting tracers.
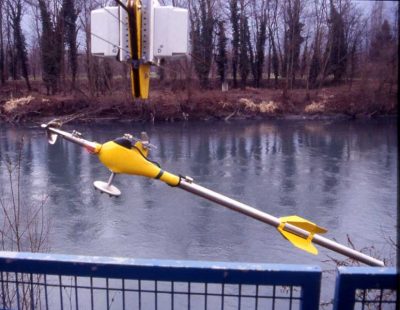
InVelocity field metrology via explorationThe flow (Figs. 6 and 7) has been restricted to the surface velocity (with the help of"Floating", the rods are weighted according to current). It is now possible to use the speed sensor to obtain a more completeVelocity fieldPicture:MachinerySpool(Figure 6) – Propeller rotating in proportion to the local velocity of the current –Electromagnetic– The displacement of the water produces an induced voltage that is proportional to the local velocity of the current (Faraday's principle).
Figure 6. Hydrographic reel implemented at the Grenoble campus in Ilère.
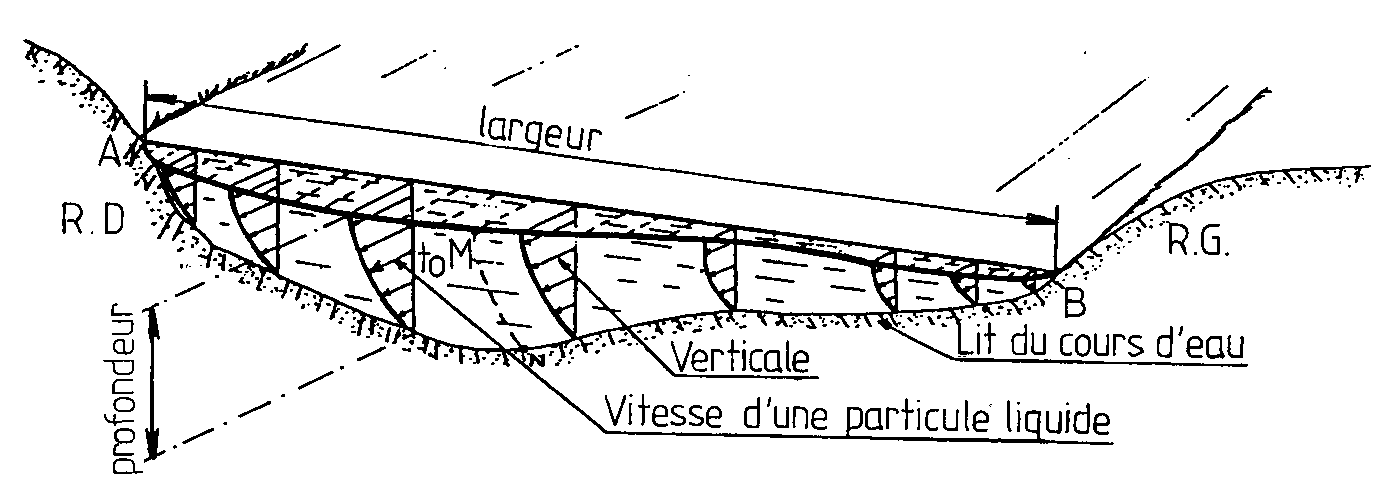
Figure 7. Principle of measurement by exploring velocity fields. Plot velocity by stopping at several depths and several verticals for 30 to 40 seconds.
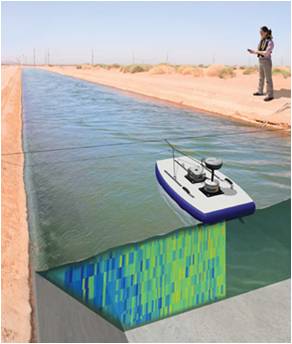
Since the early 1990s,ADCP profiler(Acoustic Doppler currentProfiler: an oceanographic device based on the Doppler effect) has become aTechnologyReal leap(Figure 8). themSignificantlyReduceOn-site measurement time, especially on large rivers, and is now suitable for small rivers (but requires a minimum depth of 50 cm).
Figure 8. ADCP velocity measurement is based on the pulse Doppler principle: an ultrasonic pulse is emitted into the water and the frequency shift of the backscattered echo from the suspended particles is analyzed. The device typically has 3 or 4 transducers that emit diverging sound beams around a vertical direction, allowing the vertical velocity distribution to be measured in three dimensions
Dilution metering(Figure 9) includes theTracerInject into the river and monitor its concentration over time. According toLaw of conservation of mass, under the condition that the tracer is well mixed (if there is no water loss in the dilution tank), the dilution coefficient is proportional to the river flow.
Several generations of tracers have been used historically and the current available technology is preferredFluorescent tracer(rhodamine, uracil) or edibleSalt.
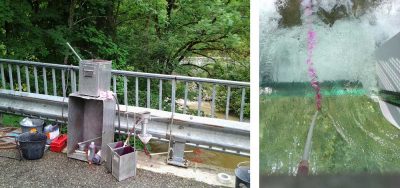
Figure 9. Left: Rhodamine injection device. Right: Rhodamine enters the water stream. Tracers (which are harmless to animals and plants) do not discolor the water. Its dilutions were then analyzed with a fluorometer (to measure its fluorescence decay), which is still in the laboratory today. You can be on site directly tomorrow
3.3 Link height and flow: calibration curve
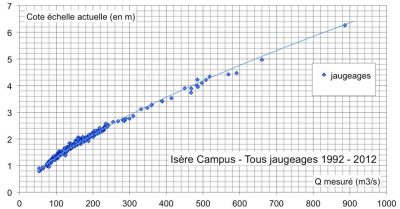
ZSubtleThe key isSet the curve, that isBetween height and flowRelationship (Figure 10).Long drawn by hand based solely on the operator's expertise, the definition of this curve now requiresDecision support tools, that is, a tool that combines statistical methods, taking into account both the metrological uncertainty of the measurement and the hydraulic model.
If the height-flow relationship is considered stable over a given time period, the height-flow relationshipNot necessarilyFollowTime lapse isStable, especially when the hydraulic control device is not constructed of man-made structures. Vegetation, human intervention, flooding – through associated solids transport, erosion or deposition mechanisms – alter the flow distribution of rivers to a greater or lesser extent. Therefore, the monitoring setting curve adjusts the actualMeasurement strategy, in order to adjust over time (frequency of measurement) and according to water conditions (low water, average water, flood). Monitoring and plotting the calibration curve isHydrographic surveyCore business.
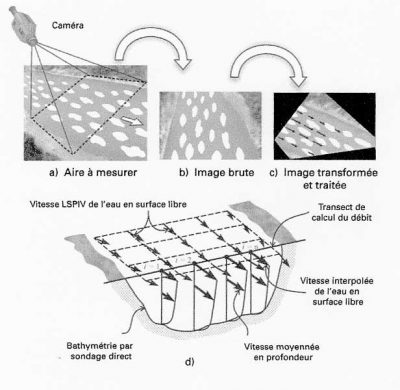
The state of existing technology is recent and remains to allow device evolutionContinuous speed measurement, whether it isOn the surface(Speed Radar) or in-flow lien (Transit timeUltrasoundOr Doppler effect). The principle of the water level gauge has not fundamentally changed:Height, speed, velocityCalibration relationshipThroughout the operation of the measurement siteStill needs calibration. These systems have been implemented when the unique relationship between altitude and flow was not verified (rivers were affected by navigation and/or tides), but current technological developments make it feasible to distribute this type of equipmentmatchThe cost has been reduced.New imaging technologies bring promising innovations: video image processing determines the surface velocity field of a river (Fig. 11). Here we use the displacement of all solids transported on the surface (twigs, bubbles, leaves, etc.) as well as the turbulence of the flow. The technique is derived from particle image velocimetry (PIV) used in the laboratory, but is used to study large river-type objects, hence its name "Large Scale PIV (LSPIV)." This includes:
Figure 11. LSPIV principle: a) seeding of floating bodies, b) image recording, c) positive image correction, d) flow calculation from LSPIV surface velocity measurement (from Muste)
OneCalculation of displacementUse statistical analysis of the flow of tracers in correlation with the pattern.
Knowing the geometry of the river segment and using a vertical velocity distribution model, it can be obtained fromLSPIV velocity fieldEstimateTotal traffic.
This future technology will beDensification Flood MeasuresThe road was opened: the short-lived nature of the event, traffic difficulties (the roads were flooded), security conditions (violent traffic) did not allow the team to carry out the necessary intervention. However, ifPoor visibility(night, fog), it cannot be implemented.
3.4 Check data consistency
Elevation to flowTransformation, Critique of Results, DatabaseInArchiveIt is the last part of the hydrographic survey business.
At the stationOn recordCarry outConformance testing(identify offsets and sensor drift, smooth raw signals, fill in gaps during recording failures) and go through more or less complexHydrological model for testing:
InRelated to otherUpstream and downstreamMeasurement site,
PassReferenceCollected at the measurement siteHistorical data, comparing it to previous years, looking for explanations based on rainfall measurements, known impacts (water withdrawals, etc.)
The entire process is iterative and therefore may result inQuestionCurrent calibration curve, thereby redefining its layout and even calibration strategy. hydrologyEventLong after it happenedThe information obtained (hydraulic models, flood measurements...) may lead to significant changes in the results published by the site. usually requiredEighteen months to two yearsTo combine information.In recent years, hydrologyUncertainty in metrologyQuantifyGreat strides have been made, but the industry remainsResearchField. It can be considered that at the best sites (i.e. those that can track the calibration curve at less than 4 or 5 meters per year) the currents encountered 80% of the time are combined into5%Within.
4. What are the current hydrographic survey challenges?
Let us remember that hydrography is aLabor intensive process, requires travel in the field and is a true combination of metrology, hydraulics and hydrologyCraftsman's tasks. As a result,A stationAnnual operating costsUsually approximatelyInitial investment costOf magnitude. Therefore, hydrography is aLong termMission, budget cuts have a significant impact on the quality of data produced.The hydraulic method is also aComplexProcess as it affects the natural environment and all its associated hazards, andDataMaturity can take a long time. So there may be a gap years later between the information provided on the spot (even used to make a decision) and the merged data after criticism or discovery of new elementsSignificantlyDifference (For extreme regime values, in a flood or drought it isTwice) their occurrence.
Let DOWESTON sales engineers select models for you. We have prepared quotations for multiple products and can send them to you at any time!
Our experts are ready to helpWherever you are, DOWESTON's experienced engineering team is ready to support your product selection and applications - contact us today!
Tell us about your measurement task and we will help with product selection and technical questions.info@doweston.com
We value your privacy!
We and our partners use cookies and similar technologies to process personal data (such as IP address or browser information) in order to personalize the content and advertising shown to you. This helps us display more relevant content and improve your browsing experience. We also use it to measure results and tune website content. Because we value your privacy, we are asking for your permission to use these technologies. You can change or withdraw your consent at any time by clicking the settings button in the lower-left corner of the page.




 Home